Friday, 30 December 2016

Africa's climate disaster rhythms from 2006-2015: How good do they sound?


Do not call the forest that shelters you a jungle ~ African Proverb

Overview


Boasting as the second largest continent in size and population, Africa is home to approximately 1.2 billion people spread over 54 countries.  The location of the African continent – surrounded by the Mediterranean Sea, the Indian Ocean, and the Atlantic Ocean – exposes it to a mix of climates. Most of the Northern parts of the continent are deserts and arid or semi-arid regions, while the rest of the continent is a mix of savanna plains and rain-forest. Despite Africa's ecological richness and beautiful landscapes, the risk of fragmentation and degradation are apparent. A recent example is the receding lake Chad in the Sahel region.

The increasing population further poses a strain on the available resources in most of the countries. The African economies are heavily dependent on natural resources. In assessing the non-linearity in the effect of temperature on global economic production,  Burke, Hsiang and Miguel (2015) affirmed that by 2100, most African countries would be poorer than present if the rising temperatures and effects of climate change are not mitigated against. Perhaps the most important question is how can environmental sustainability and resilience be achieved in Africa amid the rising populations and persistent exposure to natural hazards?
                

Disaster Profile


Beyond the size, resource-richness and endearing beauty of the African continent, the the risk of occurrence and exposure to climatic events remain constant. The most prevalent natural disasters in Africa are the floods, storms, drought, wildlife and extreme temperatures (EM Database). The frequency of occurrence of these disasters has varied from 2006-2015 although in totality, the floods, storms and drought are common phenomena. 

Frequency of occurrence of natural disasters in Africa from 2016-2015 (Source of  data: EM DAT database)

Variation in occurrence of  disasters  (floods, storms, drought, extreme temperatures and wildfire) in Africa from 2006-2015 (Source of Data: EM Database)

Although flood is the most common natural hazard in Africa, there is a variation among countries in terms of prevalence. For instance, Kenya has experienced 28 floods within the 10 year period as compared to 1 flood event in Libya. Other Africa countries prone to floods - with 10 or more flood events - include Angola, Ethiopia, Nigeria, Burundi, Algeria, DR Congo, Malawi, Mozambique, Niger, Tanzania, Burkina Faso, Mali, Sudan, Chad, Ghana and Morocco, in descending order.
Prevalence of flood events in various African countries from 2016-2015 (Source of  data: EM DAT database)


Flooding is mostly common in low elevation zones of Africa where, according to Kamal-Chaoui and Robert (2009), are inhabited by approximately 1-5 million people. A study by Di Baldassarre et al 2010  also found that the risk to floods in most African countries has increased due to intensive yet unplanned developments in flood-prone areas.


Between 2006-2015, droughts has occurred 5 times in Ethiopia and; 4 times in Kenya and Zimbabwe; 3 times in Burundi, Djibouti, Malawi, Mali, Mozambique and the Niger. The very nature of droughts - slow onset - means that a drought event can take longer to be manifested.


Implications


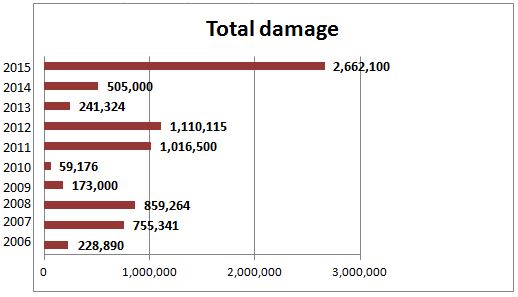
At 20,004 deaths between 2006-2015, droughts have caused the majority of natural disaster-related fatalities in Africa despite their low occurrence. The high numbers are due to the Somalia drought that led to the loss of approximately 20,000 lives, due to hunger and lack of water, leading to the highest number of total deaths from the five disasters as shown in the graph. The floods caused 25,360 deaths within the same period followed by storms (1,356) and wildfire (131). The figures below summarize the losses and damages from the disasters in question in Africa for the period 2006-2015.


Total occurrence of disasters (floods, storms, drought, extreme temperatures and wildfire) vs fatalities in Africa from 2006-2015 (Data from source: EM Database)

Total number of people affected from disasters (floods, storms, drought, extreme
temperatures and wildfire) in Africa between 2006-2015 (
Data from source: EM Database)
   
Total damage (x1000 US Dollars) resulting from disasters (floods, storms, drought, extreme
temperatures and wildfire)in Africa between 2006-2015 (
Data from source: EM Database)


Conclusion


The past rhythm of disasters in Africa is not so appealing to the ear after all. Can the future be any better? The impacts of climate change are projected to increase under business-as-usual scenario and this is bound to have implications across continents and regions. It is therefore safe to argue that with heightened level of exposure to the risks of natural disasters coupled with low adaptive capacity in Africa, climate change is set to increase vulnerability. It is also worth noting there are a number of concrete initiatives that have been rolled around out by countries and various agencies around the continent to reverse the current disaster trends, help communities adapt and build resilience. These responses will be discussed in the subsequent posts. Stay tuned.

Friday, 23 December 2016

Climate Extreme Events in the Oceania from 2006-2015: A summary

The tables and graphs in this post provide a clear profile of disasters and their impacts in the Oceania.

Disaster
Total affected
Total damage
Drought
2,593,384
883,000
Flood
726,730
12,536,747
Storm
700,733
12,804,633
Wildfire
12,609
2,236,000
Extreme temperature
2,000
0

Occurrence of Extreme Events in the Oceania countries from 2006-2015


Country
Total deaths
Australia
777
Papua New Guinea
203
Solomon Islands
79
Fiji
51
Vanuatu
23
Samoa
21
Micronesia
5
New Zealand
4
French Polynesia
1
Tonga
1


Number of deaths and occurrence of extreme events from 2006-2015


Country
Total affected
Total damage
Papua New Guinea
3,075,878
87,000
Australia
357,353
26,241,354
Vanuatu
240,956
449,400
Fiji
149,808
261,526
Solomon Islands
135,166
24,000
Micronesia
35,000
11,000
Samoa
12,703
133,000
Marshall Islands
7,344
0
Tuvalu
4,613
0
Tonga
4,014
34,000
French Polynesia
3,411
11,000
New Zealand
2,957
1,208,100
Cook Islands
2,810
0
Kiribati
1,805
0
Wallis and Futuna
1,252
0
Northern Mariana Islands
360
0
Tokelau
26
0
Palau
0
0


Friday, 16 December 2016

Natural Disasters in Europe: A summary

From Asia 's hotpot to the journey through the Americas, this week's focus is on Europe! Kreibich et al 2014  argue that because of the changing climate, Europe will be faced with more impacts from natural disasters in the coming years.
“Climate change is one of the largest threats to human and ecosystem health (in Europe), reducing the supply of food and nutrition, causing premature deaths from extreme weather events and affecting vital ecosystems” UNEP, 2016.


Overview


Disaster type
Occurrence
Total deaths
Homeless
Total affected
Total damage
Drought
7
0
0
216194
6051573
Extreme temperature 
141
67819
0
621557
1932601
Flood
232
1069
53138
4066755
50978320
Storm
137
380
2963
986477
41061400
Wildfire
25
241
5692
1020865
8173274
Data Source: EM-DAT Database (Accessed 21 December 2016)

The main disasters in Europe are drought, extreme temperatures (heat waves), flood, storms and wildfire. Based on the data from the EM DAT database, the frequency of these hazards within the past decade shows variations in length and magnitude- floods are a common phenomena followed by extreme temperatures and storms respectively. As shown in the table, most deaths have resulted from heatwaves and floods. However, significant damages result from floods and storms with the largest number of people being affected from the former. The same scenario is observed in Asia and the Americas which are more impacted by floods and storms.

Frequency of disasters in Europe from 2005-2015
Data Source: EM-DAT Database (Accessed 21 December 2016)


Floods and heat waves


Rojas et al. 2012 assessed the impacts of river floods in Europe, based on both the adaptation and non-adaptation trajectories, and found a projected increase in the number of affected population. The study also projected that, if adaptation measures are not put in place, the number of damages resulting from river floods will reach €98 billion per year by 2080. Conversely, the damages will be lower in the phase of adaptation to as much as €53 billion per year by the same period. However, Rojas and colleagues note that there are wider variations at country level with countries like the Czech Republic, France, Hungary, Italy, Romania and the United Kingdom set to incur high damages. Variations are also evident at country level with some parts of a given country being more at risk to river floods than the rest of the country. A study by Alfieri et al. 2015 affirms that the frequency and magnitude of the floods in Europe will increase with “flood peaks with return periods above 100 years are projected to double in frequency within 3 decades”. Other studies have also assessed the impact of sea level rise in Europe and the resulting impact due to coastal flooding.


The 2015 summer in Europe was marred with extreme temperatures, with the highest temperature in Berlin reaching 37.9°C, London at 36.7°C, and Paris at 39.7°C. The surface area temperature anomaly over central Europe for the period was 2.40°C above the 1964–1993 mean. This level of warming closely matched with the 2003 summer heat wave that lead to massive loss of lives. In assessing the chances of extreme temperatures since the 2003 European heat wave, Christidis et al. 2015 found that the occurrence of heat wave events is now twice a decade as compared to the early 2000s where heat waves occurred once a decade.

Focus on the top 5...


Occurrence of natural disasters in European countries between 2005-2015
Data Source: EM-DAT Database (Accessed 21 December 2016)


Number of people affected by the natural disasters between 2005-2015
Data Source: EM-DAT Database (Accessed 21 December 2016)
Death resulting from natural disasters, 2005-2015
Data Source: EM-DAT Database (Accessed 21 December 2016)

Cost of damages resulting from natural disasters, 2005-2015
Data Source: EM-DAT Database (Accessed 21 December 2016)

Friday, 9 December 2016

The journey through the Americas

Picking up from the previous post where I briefly profiled disasters in the Asia Pacific region for the past 10 years, this week I choose to shift my attention to the Americas. Last month, I highlighted a case of Louisiana flood that led to loss of 13 lives and destruction of properties and businesses, and just recently, the world witnessed as Haiti was hit by a major storm - Hurricane Mathew - causing a great deal of devastation. NASA termed the Hurricane as "the strongest storm to hit the Caribbean nation in more than 50 year". But this is just a fraction of the cumulative number of disasters that have occurred in the region, and their accompanying impacts on human and ecological systems.

Hurricane Mathew
© NASA

Overview


The World Bank estimates the population of the Americas at approximately 1 billion people . The countries in this region heavily rely on primary production and exploitation of natural resources for exports. The region boasts of an incredibly rich biodiversity despite continued loss of large forest cover with decreasing deforestation. Aide and colleagues argue that such contrasting dynamics present a level of uncertainty in terms of future alterations resulting from continued land use. Furthermore, such dynamics are highly linked to external factors like population trends and the demand for products (both for internal use and for exports).  As a result of the existing pressures, large biomes like the Amazon forest, are significantly reducing in size. In assessing the "spatial patterns and statistical relationships between deforestation and changes in pasture and soybean areas", Barona et al. 2010 found a correlation between the high rate of deforestation and increasing  pasture and soyabean grounds.

Extreme climate events


Data from EM DAT database indicates that a number of extreme events (drought, extreme temperature, flood, storms and wildfires) in the Americas have occurred in the past decade, although at varying frequency and level of intensity. Of the analysed events, floods and storms tend to occur more times in a years compared to drought, heatwaves and wildfire.

Frequency of extreme events in the Americas, 2006-2015 (Source of data: EM-DAT Database).
The major disasters in the Americas region are Storms and floods , having occurred 315 and 353 times respectively from 2006-2015. A 2014 World Bank report  titled, "Turn Down the Heat: Confronting the New Climate Normal" estimated that a approximately 29 million people in the region live in low-lying coastal zones that increases their risk coastal flooding and storm surges. In 2015, for instance, Hurricane Erika killed 37 people in Dominica and caused losses of over 228 million dollars (nearly half of Dominica's annual GDP). Other major hurricanes to hit the region include Hurricane Galveston in 1990, Andrew in 1992, Katrina in 2005, Wilma in 2005, Andres in 2009, Felicia in 2009, Sandy in 2012, Patricia in 2015 among others.

Drought
Extreme temperature
Flood
Storm
Wildfire
Occurrence
47
38
353
315
42
Total death
4
2,132
6,270
5,515
133
Injured
0
24,262
11,962
9,053
763
Homeless
0
5,247
445,506
282,246
33,901
Total Affected
47,398,840
1,611,939
40,753,477
105,78,466
902,680
Total damage(1,000 USD )
39,303,400
5,194,000
65,134,735
276,715,736
12,136,400
Losses and damages between 2006-2015 (Source of data: EM-DAT Database)

Floods have led to a majority of deaths in the past 10 years followed by storms and extreme events. As a result, an incredibly huge number of people were affected. Although droughts are seen to cause insignificant deaths in the region, the number of people affected tend to be higher compared to those affected by other disasters. More people are also affected by floods and storms. For the United States alone, the National Weather Services' statistics show that floods have caused higher fatalities on average compared to any other disasters.


© NOAA

Conclusion


The frequency and intensity of extreme events in the Americas have been on the increase in the past decade with steep trends in areas where storms and floods are common phenomena. The scenario is likely to worsen in the face of climate change as global warming, coupled with the effect of El Nino Southern Oscillation, increases the risk of more severe weather. As a result, increased losses and damages are bound to be encountered, if adequate measures will not be put in place.